A Prodigy’s 3D Data Shows Everyday Life in Ukraine: Interview with Hidenori Watanabe (#2)
Related Articles


Immediately following the Russian invasion on February 25, this man has continuously informed the world about the situation in Ukraine, using 3D processing technology and satellite images. He is Professor Hidenori Watanabe of the University of Tokyo Graduate School, working to create comprehensible digital maps by digitally mapping records of disasters and wars. Amid the ongoing tension in Ukraine, we talked with Watanabe, who continues to update the digital map “Satellite Images Map of Ukraine.”
(#2 of a two-part series. Continued from #1 )
Most 3D Images Created by Locals
– The 3D images posted on Twitter showing the current situation of Ukraine is attracting attention. How are the 3D images created?
Watanabe: The 3D data is made from drone footage videos, using a method called photogrammetry. We use images created by the locals in Ukraine and people from other countries around the world.
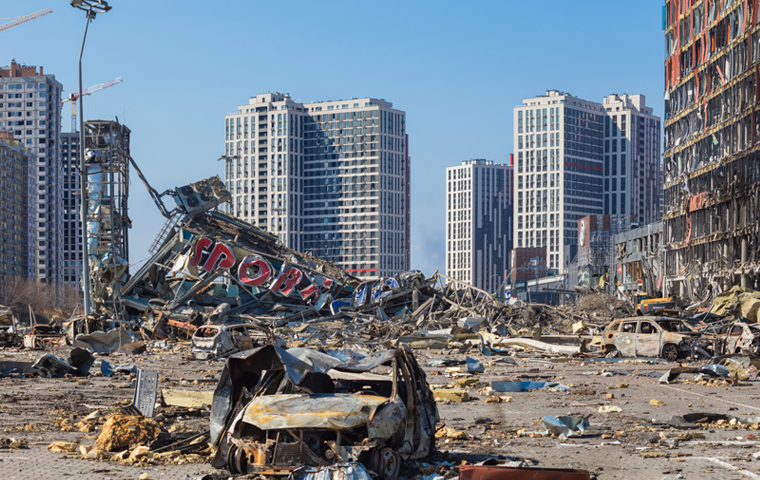
For example, the 3D data for a destroyed car image was created by Maksym Khovalko, who used to live in Ukraine. I found the published 3D data of a car that collided with a Russian tank and was crushed on February 25, 2022. Maksym kindly agreed when I asked if I could use the data on our 3D map. He said he had been keeping an eye on our activities.

Maksym is now living abroad, but his colleagues are still in Kyiv and the other day, they created and provided us with new 3D data for a destroyed bus.
– Do you request the local people to create these images?
Watanabe: No, these people already have photogrammetry skills. We found people who create their own 3D data and post them on Sketchfab, a data sharing platform. We contacted them online and got permission to use the data.
On Sketchfab, we also found the data for the housing complex basement used as a bomb shelter. Considering the nature of the content, we have attached the image a little off from the actual spot.
This data was posted along with the comment, “I often have to sit in this place and listen to the constant sounds of explosions and gunshots not far away…” It was created by Yaroslav Veprev, a teen living in a housing complex in the border city of Donetsk. Russia has recognized the region’s “independence,” calling it “Donetsk People’s Republic.”
Connecting Online through Technology and a Sense of Mission
Yaroslav is now 19. Reading the Ukrainian media articles he sent me, I found out he was a geek who created animations at 12, with the first game he made downloaded over a whopping 10 million times. No doubt, it’s unfortunate that a war erupted. But amid that, I appreciate I could encounter talented youth like Yaroslav and other creators, with international online communities forming.
Making use of their skills, many people are telling the situation they face, and posting their thoughts. One person created 3D data of the anti-war wall graffiti in Budapest, Hungary. This data is also included in our map.
– With more attention on the technical side, isn’t there fear of deviating from the purpose of “informing the situation of the Ukraine Crisis”?
Watanabe: The locals posting information are not doing it to show off their skills. They are risking their lives to convey the most realistic view of what’s going on around them by utilizing their techniques. I want to stress that point.
We also seek optimal presentation through constant updates. To let viewers see various data from multiple aspects in line with the ever-changing war situation, we rearrange the order of the slides and compile the data for each city.
Like the Activity Tracking Map of Quake Victims Released in 2016

– It must be a significant weight on you, to be on the receiving side of those people remaining in Ukraine, committed to conveying the local situation.
Watanabe: There are actually people who are trying to inform the situation while fearing their own safety. But I have no right to tell them to quit that.
I also hear there are many people who have no means of escape, even if they wanted to. What we can do at this point, in Japan, where we can distance ourselves from censorship and arrest by some kind of authority, is to put together those desperate voices from Ukraine in a comprehensible way and make them available to as many people as possible.
In 2016, in collaboration with Iwate Nippo Newspaper, we created the map, “We Shall Never Forget—Last Movements of Tsunami Disaster Victims.” In 2021, for the 10th anniversary of the Great East Japan Earthquake, we released the map, including the names of the victims. This has something in common with our project for Ukraine.
By showing the names, the map lets you feel the presence of the people who died, instead of mere data.
You could say the satellite image is looking at the earth from “god’s perspective.” It’s difficult to feel “human activities” from satellite images. But combining them with the 3D data created by daring locals adds the “human feel” to the digital maps. With this, I hope to motivate those of us living in Japan, and people around the world to think of the crisis as their own issue.
Driven by the Mission—“For Future Verification”
– However, unlike records of World War II or the Great East Japan Earthquake, the invasion of Ukraine is an ongoing crisis.
Watanabe: That’s right. Working on the project, we feel the emotional burden. We need to be prepared. Yet, we won’t quit doing this because having the skills, we feel it’s our mission to share the real-time situation in Ukraine.
And, although no one knows what will become of this war, we’re doing this so that people can use it to verify this war 10, 50, or 100 years from now. Since we live in this age and happen to have the expertise. I believe we must do it.
– A month has passed since the Russian invasion began. How much data have you published so far?
Watanabe: We have released about 140 items, including 3D data, 360 panorama, and satellite images. This means we have added roughly four items a day.
We can’t say these digital maps will significantly change the war situation or end the war. Yet, it’s crucial for each of us to keep on doing what we can and continue to speak out. We will continue this, at least until the war is over.
(April 5, 2022 postscript: The missing photojournalist Maks Levin, who had filmed drone footage in Borodyanka, Ukraine, was found dead in Kyiv. His drone footage data, converted into 3D by stim3on, is used for the “3D data & 360 panoramas of Ukraine.”)
◆ Digital maps created by Hidenori Watanabe et al.
・Satellite Images Map of Ukraine
・3D data & 360 panoramas of Ukraine
・Satellite Images of Mariupol
・Satellite Images of Around Irpin
・Satellite Images of Chernihiv
This is a translation of the Japanese article published on March 31, 2022 on Bunshun Online.
 JA
JA EN
EN